Why Your Process Simulation Doesn't Match Plant Data (And What to Do About It) A practical guide to making your process simulations actually match reality
Why doesn't my simulation match the plant data?
If you work with Aspen, HYSYS, UniSim, ChemCAD, or any serious process model, you've probably asked this at some point. Or you've been asked by someone else… usually at the worst possible moment.
What causes process simulations to diverge from plant data? Technical mismatches (wrong thermodynamics, bad boundary conditions, poor data quality) combined with organizational gaps (operators run things differently than your model assumes). But here's the thing: these are fixable once you know where to look. Even more, these could become your most valuable asset.
Can you actually make your simulation match plant performance? Yes. With a systematic calibration workflow, you can get your model mostly within 3-5% error on key outputs. I've done it dozens of times across refineries, chemical and other plants. The fact that your simulation matches plant data is what separates it from being just a theoretical exercise.
You spend weeks building a model that looks beautiful. The flowsheet is clean. Everything converges. The design case makes sense. Then the plant runs, and suddenly key variables don’t line up. Yields are off. Energy consumption is wrong. Temperatures drift. Someone starts saying things like "maybe this models isn’t reliable." They are. But the uncomfortable truth is this:
Your model is not wrong. The plant is not wrong. It is very likely that they're just not describing the same reality. And once you understand why, fixing it becomes a lot more systematic than people think.
Who This Is For
This article is for:
• process engineers validating models after commissioning
• consultants building simulations for clients
• plant engineers trying to explain performance gaps
• technical managers deciding if simulation-based optimization is worth the cost
If you've ever stared at a 10–15% mismatch and thought, "what the hell is wrong with my model?", you're in the right place.
Why Simulations Diverge from Plant Data (The Real Reasons)

Most mismatches are not caused by one big mistake.
They're caused by a stack of small mismatches, and they compound. In my experience, around 80% of the problem usually comes from the same five areas:
- wrong thermodynamics (or missing impurities),
- wrong boundary conditions,
- bad plant data,
- missing control behavior,
- missing operating philosophy (the "unwritten plant rules").
Let's go through them.
Why Do Default Thermodynamic Assumptions Fail in Real Plants?
Simulation packages ship with "reasonable" defaults. And for clean textbook systems, those defaults are fine. But real plants are not textbook systems.
They have:
- impurities,
- side reactions,
- fouling,
- non-equilibrium behavior,
- unknown trace components,
- lab measurements that don't agree with online analyzers.
I recently worked on a distillation model where the design case looked perfect, but the plant validation showed a stubborn ~15% yield error. The root cause wasn't a missing valve or a wrong tray efficiency. It was the feed.
The real feed contained components (and ionic effects) that completely changed phase behavior, and the default thermodynamic method simply wasn't capturing it. The software will not "guess" your impurities. You have to tell it.
What to do instead:
List your assumptions. Thermo method, property correlations, heat capacities, reaction set, etc. Don't trust them because they're "default."
Test thermo packages against plant data. Pick 10–20 validation points and compare. Use Peng-Robinson, NRTL, UNIQUAC, Wilson, whatever makes sense. Pick the one with lowest mean absolute error: <2°C on temperatures, <1 mol% on compositions.
Add complexity gradually. Start simple with steady-state ideals. Get that working. Then add real kinetics, tune Arrhenius parameters using pilot data or upset conditions. Validate after each step. Don't try to fix everything at once or you'll never know what actually improved the model.
Even one day spent doing this properly can cut the mismatch in half.
Why Do Feed Compositions and Boundary Conditions Matter So Much?
Boundary conditions are sneaky because they look "obvious."
You assume:
- feed composition is stable,
- utility conditions are constant,
- pressure drops are fixed,
- upstream units behave the way they did in the design case.
But in real operation, none of that is true. Feed composition changes. Heat exchangers foul. Steam pressure fluctuates. Recycle loops amplify small errors.
I've seen cases where a 3–5% shift in feed composition created a 10–15% deviation downstream, and everyone blamed the reactor model.
The reactor was fine. The inputs were wrong.
Studies show that boundary conditions cause about 30% of all validation failures, especially in recycle-heavy processes where errors just compound every pass through the loop.
What to do instead:
Use measured profiles, not design specs. If the plant feed swings between 145–155°C, don't model it as 150°C. Model it as a function of upstream conditions.
Log real averages. For steady-state validation, pull 24-hour averages from the historian during a stable period. Use actual measured data, not what the P&ID says should happen.
Run sensitivity sweeps. ±10-20% on key boundaries is usually enough to identify what actually matters. Make a simple tornado chart and focus on the top 3 drivers. Fix those first, revalidate, then move on.
This step alone resolves cca 40% of mismatches in many projects.
How Does Poor Data Quality Destroy Model Accuracy?
This is the part nobody wants to hear.
Plant data is often wrong. Not because people are incompetent, but because plants are busy places and instrumentation has a life cycle:
- sensors drift,
- analyzers go out of calibration,
- lab sampling is inconsistent,
- some values are manually entered,
- different shifts log things differently,
- the historian stores "something," but not always the right thing,
- data could be taken during unstable operation.
I've wasted days chasing "model errors" that turned out to be one uncalibrated thermocouple that had been wrong for two years. Simulation model can be valuable to point you to examples like these.
Research shows data quality is the top barrier to good models, with inconsistencies skewing mass balances by 5-10%. Sometimes way worse than that.
What to do instead:
Clean the data before you calibrate anything. Export to Excel or Python. Apply 3-sigma outlier filtering. Handle gaps under 10% with linear interpolation. Select stable operating periods only, flag and exclude startups, shutdowns, upsets.
Do mass-balance checks. If your atom balances don't close above ~98%, you don't have validation data, you have noise. Fix the measurements first.
Cross-check sources. Compare online analyzers to lab samples. Use reconciliation software if you can (or even simple least-squares weighting to favor reliable streams).
Things like "standard deviation on redundant measurements should be under 2%". Store everything in a shared folder so your team can audit it.
If you skip this step, everything after is pointless. Clean data make everything else easier.
Why Don't Steady-State Models Capture Real Plant Control?
This is one of the most common blind spots.
Steady-state models assume:
- perfect control
- instant response
- no overshoot
- no valve stiction
- no selector logic
- no interlocks
- no operator overrides
But real plants are not just "process." They are process + control + humans.
And during transients startups, trips, process changes, those differences can easily produce 30–50% mismatch in trends.
What to do instead:
Use dynamic simulation for the critical loops. Import real PID parameters from the DCS: Kc, Ti, Td values. Not theoretical tuning equations. Actual plant values.
Model discrete logic explicitly: interlocks, ramps, overrides, trips. Add controller faces with if-then blocks: "if high level, trip pump AND close feed valve."
Validate against real transients. Use data from actual startup events or grade changes. Trend your simulation against plant data. You should see 95% overlap in response curves.
Use hybrid metrics. Calculate steady-state RMSE for time-averaged values. Calculate dynamic ISE (integral square error) for transients. Tune until both are under 5%.
If your goal is to match the plant, you cannot ignore the DCS.
How Do Unwritten Operating Procedures Break Your Model?
Plants don't run on P&IDs.
They run on:
- operator heuristics
- unwritten rules
- "we always do it this way"
- workarounds for fouling
- constraints nobody wants to admit exist
Your simulation might predict 95% yield at design conditions.
The plant might consistently deliver 88% - not because the design is wrong, but because operators intentionally run cooler to avoid coking, or avoid pushing a compressor near surge, or bypass something in winter.
None of this is documented properly. It lives in operators' heads and maybe in some shift supervisor's email from 2015 that nobody can find anymore.
What to do instead:
Talk to the operators. Schedule an hour with each shift. Ask: "What are the top 5 things you do differently than the design?" Document manual bypasses, unofficial setpoint adjustments, fouling workarounds, seasonal variations.
Build a scenario library. Don't just validate one operating point. Create cases for normal operation (80% of runtime), turndown (15%), startup (5%). Validate each against tagged historical data from actual events.
Make it collaborative. Have biweekly reviews where operators sign off on model updates. Track philosophy parameters in a living document visible to everyone.
This is the point where simulations stop being academic and start being useful. When you align the model with how people actually run the plant, it becomes a real digital twin.
How Do I Actually Calibrate My Simulation? (The Workflow That Works)
If you want a model that matches the plant, you need a workflow. Not random tuning.
Here's a structure I've used repeatedly across refineries, chemical and other plants.
What's the Step-by-Step Calibration Process?
Day 1: Data preparation (don't skip this)
- Export 1–2 weeks of data from the historian
- Identify stable operating windows
- Remove obvious outliers (3-sigma rule)
- Handle small gaps with interpolation
- Check mass/energy balance closure (>98%)
- Split the dataset: 70% for calibration, 30% for blind validation
Day 2: Base model tuning
- Select the best thermodynamic method (test multiple packages, pick best fit)
- Replace design boundaries with measured profiles
- Run sensitivity analysis to identify high-impact parameters
- Tune only the parameters that matter
- Target: MAE <2% on temperatures and compositions
Day 3–4: Dynamic behavior (where the real plant lives) – if relevant to your case
- Add the critical PID loops with actual DCS parameters
- Include interlocks and discrete logic (if-then blocks, ramps, overrides)
- Validate against real transients (startup, grade change, ramp data)
- Target: trend overlap that looks believable, dynamic error metrics <5%
Day 4.5 — Operating philosophy
- Interview operators and document deviations from design
- Build mode switches in the model for different operating scenarios
- Validate multiple scenarios: normal, turndown, startup
Day 5 — Validation & documentation
- Run the blind 30% dataset you set aside on Day 1
- Calculate MAE, RMSE, confidence intervals
- Run Monte Carlo uncertainty propagation (±3% on yields is typical)
- Document assumptions, data sources, validation metrics, and model limits clearly
Quarterly — Revalidation
A model is not a one-time deliverable. Plants change:
- catalyst ages
- fouling builds
- upstream quality changes
- operators change setpoints
Quarterly revalidation keeps the model decision-grade.
What Metrics Show My Model Is Actually Reliable?
Don't rely on eyeballing trends. Use metrics.
Typical targets for a well-calibrated model:
- RMSE <5% on yields, conversions, energy use
- MAE <2% on temperatures, <1 mol% on compositions (where measurement supports it)
- Mass balance closure >98% on atom balances (C, H, O, N)
- Confidence intervals — run Monte Carlo with input variances to get output ranges
Also: uncertainty matters.
A decision-grade model doesn't say: "Yield will be 90.2%."
It says: "We are 95% confident yield will be between 87–93%."
That's what management trusts. That's what makes a model useful for actual decisions.
What You Can Actually Do with a Calibrated Model
Once your simulation matches reality, it stops being "documentation." It becomes a tool.

What Business Problems Can Calibrated Simulations Solve?
Debottlenecking
Test throughput increases without weeks of plant trials. The model tells you exactly where the bottleneck is: compressor discharge pressure limit, column flooding point, heat exchanger duty. You can test scenarios in hours instead of weeks.
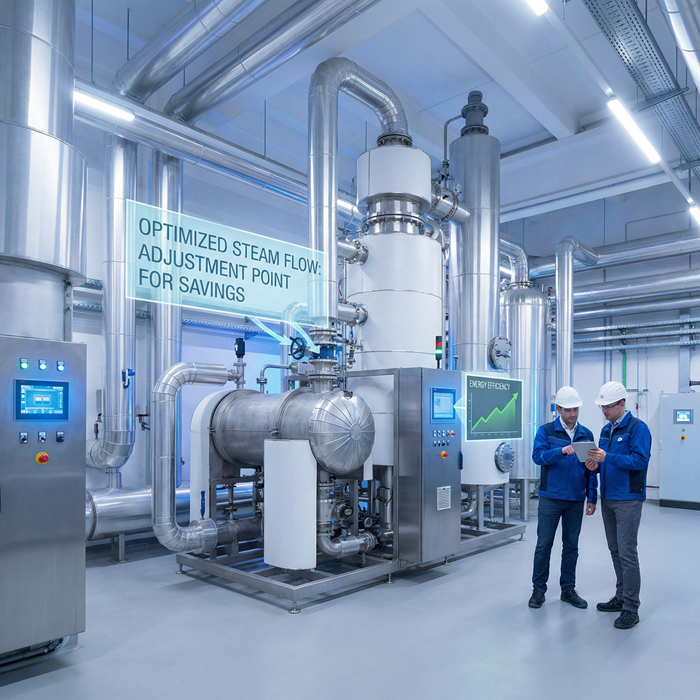
 Energy optimization
A 3–5% steam reduction is often real money - and very achievable. For a medium sized plant, that's easily $500K-1M per year. The model shows you can save steam by adjusting reboiler operation without impacting product quality.
Troubleshooting
Is the performance drop feed quality, fouling, catalyst deactivation, or operating changes? The model helps you isolate causes systematically instead of just throwing money at random fixes.
Operator training
The model becomes a safe sandbox for "what-if" events. What happens if you lose cooling water? If feed composition shifts? If compressor trips? Train operators on the simulation before they face it in real life at 3am.
Capital justification
A calibrated model produces numbers management can believe. "We're 95% confident this modification will increase yields by 8-12%" is way more convincing than "we think it'll help" or "the vendor says it should work."
How Long Does This Actually Take?
For a single unit, with decent data: around 5 working days is realistic.
If the data is messy, or measurements are missing, add another week - not for modeling, but for what I call data archaeology. Modeling is another story…
But once you've built the workflow once, every next unit goes faster because you've established the process and know what to look for.
I've seen engineers save weeks on plant trials just by having a model they can trust. Consultants deliver bids that actually work instead of being 30% off. Projects get approved because the predictions are reliable enough to bet real money on. That’s why we build models!
Key Takeaways
Main insights from this article:
- Simulation mismatches are usually not one big mistake - they're a bunch of small mismatches that compound. Fix them systematically.
- Data quality is foundational - without clean, reconciled plant data, validation is meaningless. Invest in data infrastructure first.
- Boundary conditions matter more than most engineers expect — a 5% feed composition error can cascade into 15% yield deviation downstream.
- If you ignore control and operating philosophy, you'll never match the plant - real plants are process + control + humans, not just flowsheets.
- Calibration is iterative - fix one thing, validate, then move on. Don't try to optimize 50 parameters at once.
- Decision-grade models include uncertainty, not just point predictions - use Monte Carlo or similar methods to provide confidence intervals management can trust.
- Start small and prove value - one unit, one issue, measurable improvement. Then scale based on demonstrated ROI.
About the Author
 This article is rooted in over 25 years of hands-on experience applying process modeling and simulation for the purposes of process optimization, troubleshooting, design, and monitoring - spanning refineries, chemical and other plants.
But the roots go even deeper than that. I grew up learning from my father, who brought over 30+ years of expertise in process simulation to the table, shaping how I think about models long before I ever ran one professionally. Across hundreds of simulated processes in refining and the chemical industry, and over 50 executed simulation projects, I've helped clients bridge the gap between design models and actual plant performance.
The patterns are consistent across industries. Whether you're modeling a crude distillation unit, a polymerization reactor, or a cryogenic separation train, the core calibration principles remain the same. Master these fundamentals, and your simulations become indispensable decision tools instead of expensive paperweights gathering dust on the shared drive.
And honestly? There's something satisfying about seeing your model finally match the plant. It means you actually understand what's happening out there.
________________________________________
Looking for more insights on process simulation, optimization, and plant performance? Check out our related articles on dynamic simulation best practices and data reconciliation techniques.